Project Details
The Project Details page is a convenient way to view and manage everything related to a specific project in one place. It shows basic project info (name, client, etc.), metric cards, a chart, and informational cards that let managers quickly assess project progress, budget, and team performance. They can analyze and leverage this information to forecast, plan, and effectively monitor and control project progress.
Note: This option is available to a workspace owner or an admin with extended permissions on the Business and Professional plans.
To open the Project Details page
1. Go to the Projects page.
2. Find the project you need in the list and click it.
3. The Project Details page opens and you can view the project's details there.
The Project Details page includes:
- General project info - name, project code, billing type, client, PM, budget type, and start and end dates.
- Metric cards - revenue, budget usage (total or for a specific period), costs, and profitability.
- Forecast charts - a visual forecast of time tracking or billing amounts.
- Info cards - key information about the top consumers of time and costs.
You can open the Detailed Time report by clicking the Report button to view a summary of the time spent on the project. You can also edit, duplicate, or delete the project directly from this page.
Time Range
For projects with a recurring budget, you can select the required time range using the date picker at the top of the page to view project details for a specific period.
Metric Cards
Metric cards provide a quick overview of the project's key figures. For One-Time projects, these cards display data for the project's full duration. For Recurring projects, they display data for the selected recurring period.
Revenue
This metric card shows the total income in the project currency based on the selected filters. For Time & Materials projects, the revenue is calculated as the sum of the billable amounts for hours worked and expenses. For Fixed Fee projects, it is calculated as the sum of the fixed fee and billable expenses. For Non-billable projects, the Revenue card is not displayed.
Total/Period Usage
This metric card displays the budget spent either for projects without a recurring budget (Total Usage) or for projects with a recurring budget (Period Usage). It is shown in budget units (e.g., 450h / 1,000h, $13,200 / $15,000). For One-Time projects, this value represents the total project budget, while for Recurring projects, it represents the budget for the selected recurring period (e.g., $1,500/month).
Costs
This metric card shows the total expenses incurred by the project, including the cost of hours worked and project expenses. The value is displayed in the project currency. Below the value, you will see an indicator showing the change compared to the previous period (8% higher or 5% lower).
Profitability
This metric card displays the project's profit in the project currency. The value is shown in green when the project is profitable and in red when it is unprofitable. The Profitability value is calculated as the difference between total revenue and total costs. Profitability % is calculated as: Profitability / Total Revenue × 100.
Forecasting Charts
The Time tracking forecast and Billing amounts forecast sections contain two separate charts (line graphs) that display hours worked and billable amounts, respectively.
Time tracking forecast
The project time tracking forecast chart tracks time budget progress with four color-coded lines:
- Total time tracked shows billable and non-billable hours.
- Time estimate shows the budgeted hours when an hour-based budget is set.
- Time estimate reached date shows the projected date when the budget will be reached, if both a budget and trendline are available.
- Trendline shows the average work pace based on daily total time tracked data.
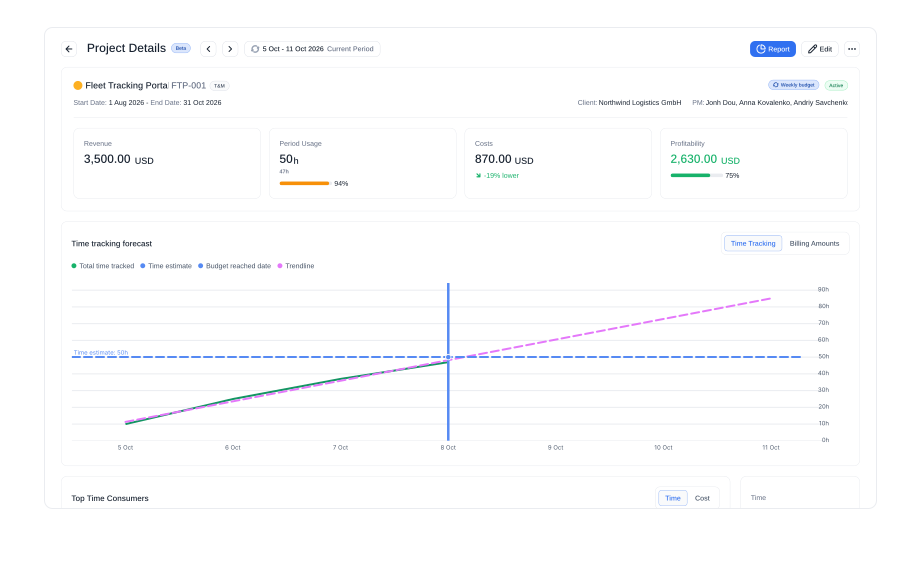
This chart helps managers see whether spending is on track to stay within the budget and when the budget may be reached.
Billing amounts forecast
The project billing amounts forecast chart tracks budget progress in monetary terms with five color-coded lines:
- Billable amount shows cumulative billable amounts for hours and expenses.
- Cost amount shows total costs for hours and expenses when cost data is available.
- Budget shows the monetary budget.
- Budget end date shows the projected date when the budget will be reached.
- Trendline shows the average pace based on cost or billable amounts.
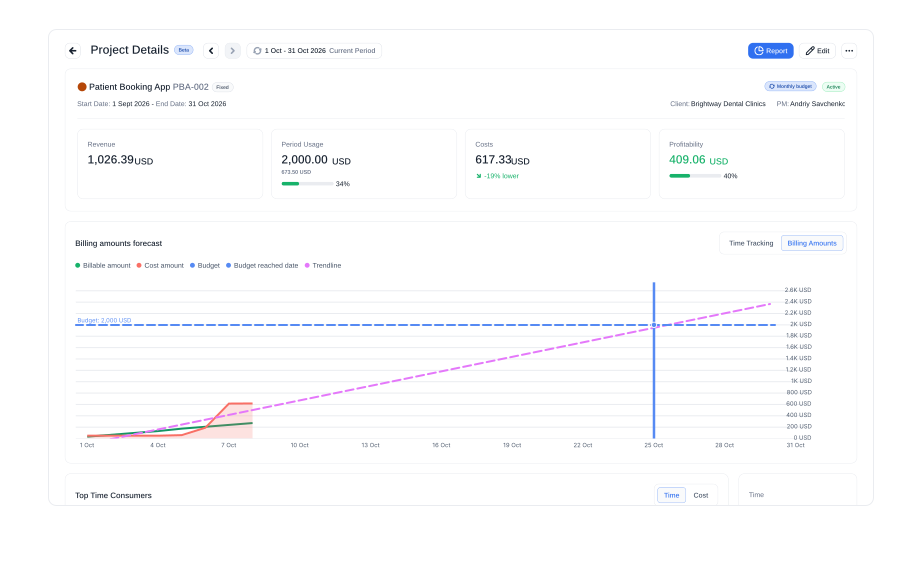
The chart helps managers spot potential budget overruns early by showing spending trends and the projected date when the budget may be reached.
Informational Cards
The Top Time Consumers and Top Cost Consumers sections contain a table and visual cards that help monitor project members who spend the most time or incur the highest costs, depending on the selected Time or Cost toggle.
The table consists of two columns:
- Member displays the member’s avatar and name, which links to the Tasks Summary report in the Time view and to the Projects Summary report in the Cost view.
- Time Spent/Cost Amount - the first displays the total hours from all time entries for project tasks within the selected time period, while the second shows the total cost of hours worked on the project plus any project expenses.
There are four info cards to the right of the table:
- Time displays total tracked time within the selected time period.
- Billable Time displays tracked billable time within the selected time period.
- Expenses displays all added expenses within the selected time period.
- Billable Expenses displays added billable expenses within the selected time period.
Didn’t find what you were looking for?
If you didn't find what you were looking for, you can make a support request or email us to [email protected]. We'll be glad to help you personally.