Detailed Report
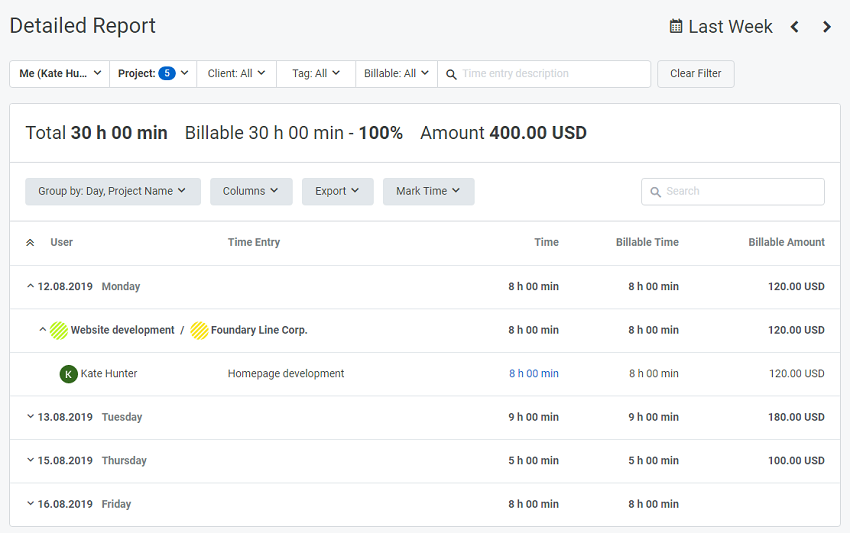
The Detailed Report shows time tracking details on a day-by-day basis. The report includes a list of tasks that were worked on by each member of the workspace on a given day. The report displays data in a table grouped by day, user, time entry, project/client, and time (duration).

You can configure the Detailed report to display the start and end time of each time entry in the Time (Hours) column and the overall time spent on each time entry in the Duration column. Please note that the start and end time and the overall time are displayed for each separate time entry even if they relate to one task. This option is called Show start and end time in detailed report and can be enabled in the Workspace settings.
Note: The Time column may change to Hours when the time format in your workspace is set to Decimal hours. Each record in the Time (Hours) column is clickable and leads you to the Time page of a relevant user.
Time Range
In the date picker at the top right corner, you can select a particular time period you want to create a detailed report for.
Click the currently selected date range to open the date picker window. The window displays a calendar with two months per page (a current month and a previous month). In the left pane, you can see a list of predefined date ranges for selection: Today, Yesterday, Current Week, Last Week, Current Month, Last Month, All Time, and Custom Range.
There are two ways of selecting the date range for a report:
- Select a custom range by clicking the start date and the end date on the calendar and then clicking Apply to generate the report for the selected period.
- Select one of the predetermined date ranges. In this case, the filter will be automatically applied to the report.
Filter
You can organize data in a report by Team, Project, Client, Tag, and Billable status to retrieve only the data you currently need.
In order to set a filter, click it and select the required checkboxes, then click the Apply Filter button. The numeral in a blue circle next to a filter shows the number of selected filter parameters. Most of the filters have search functionality to help you find the object you need.
To remove the filters currently applied, click the Clear Filter button.
Groups
Grouping organizes table data in a logical format that meets your needs at the moment.
You can group your data using the following categories: Day, Project Name, Project Code, User, Time Entry, and Work Type that can be combined by two at a time.
- Click the Group by button and select a category from the First by column.
- Optionally, select the second category from the Then by column.
- Click Apply.
Column customization and export
The Column button with a drop-down menu allows you to choose which columns to include in a Detailed Report and which to hide. Among them are Day, User, Time Entry, Project Name, Time (Hours), Duration, and Billable Amount.
Once you build a report, you can export it as a PDF or a CSV file.
Didn’t find what you were looking for?
If you didn't find what you were looking for, you can make a support request or email us to [email protected]. We'll be glad to help you personally.