Projects Summary Report
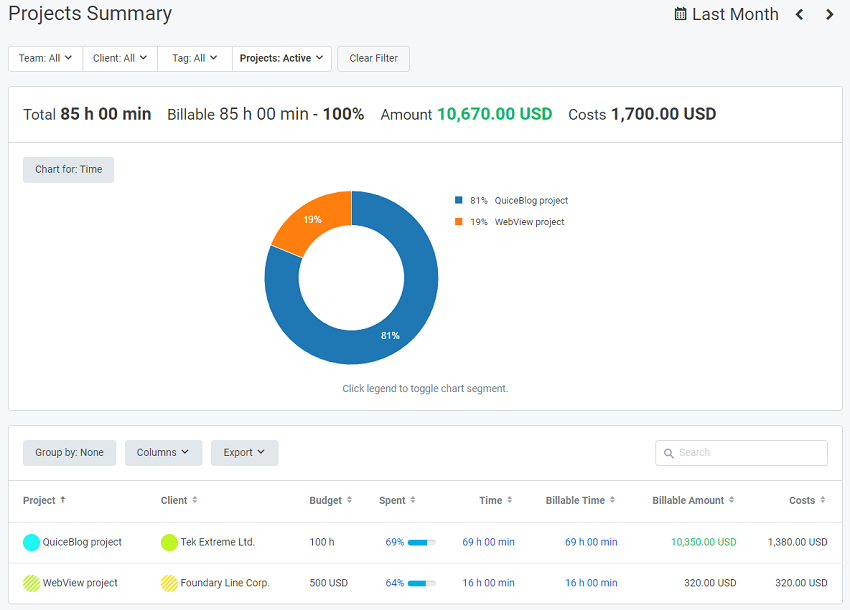
The Projects Summary report shows summarized information on all projects in your workspace, including data on clients, project budgets, budget spendings, time, and billable time. The report also includes colored charts that visually represent data contained in the report table.

Note: The Time column may change to Hours when the time format in your workspace is set to decimal hours. The Time(Hours) and Billable Time (Hours) values are links to a Detailed Report. Click a link to get more details about the implementation of each project.
Time Range
You can select a required time range in the date picker located at the top right of the report. The report will show the projects you've worked on within a specified period of time.
Filter
You can easily organize report data using the following filters: Team, Client, Tag, and Projects. This will allow you to retrieve only the data you need for a current Projects Summary report.
In order to set a filter, click it and select the required checkboxes, then click the Apply Filter button. The numeral in a blue circle next to a filter shows the number of selected filter parameters. Most of the filters have search functionality to help you find the object you need.
To remove the filters currently applied, click the Clear Filter button.
Groups
Grouping organizes table data in a logical format that meets your needs at the moment. In the Projects Summary report, you can group data only by the Client category. For this:
- Click the Group by button and select this category from the column.
- Click Apply.
If you don't want your data to be grouped, you can select None.
Note: The Group by feature is not available for a person with the Client Representative role.
Chart
Besides, a table format, report data is also represented by means of a colorful pie chart. The chart allows you to display specific data in the relative proportions depending on the filter you use. To toggle a particular chart segment, you should click a corresponding legend.
When generating a Projects Summary report, you can apply the following filters for a chart: Time (Hours), Billable Time (Hours), Billable Amount, and Costs. The chart won't display those projects that have no corresponding Chart for data.
Note: You can create a chart for Billable Time and Billable Amount only in a Professional plan. Chart for Costs is only available in a Business Plan.
Data on the chart is displayed according to the grouping category you select: either by a client or by a project (if you select None).
Column customization and export
The Column button with a drop-down menu allows you to choose which columns to include in a report and which to hide. For the Projects Summary report, you can choose the following columns: Project, Client, Time, Billable Time, Billable Amount, Costs, Budget, and Spent.
After you create a report, you can export it as a PDF or a CSV file. Click the Export button and select a format you prefer. Save the file to a folder on your computer.
Didn’t find what you were looking for?
If you didn't find what you were looking for, you can make a support request or email us to [email protected]. We'll be glad to help you personally.