Tasks Summary Report
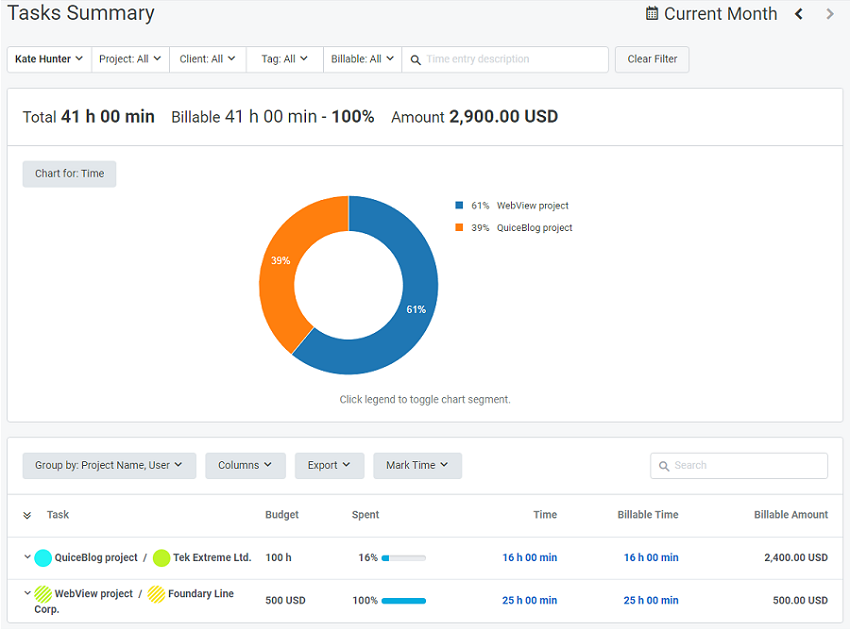
The Tasks Summary report gives you detailed information on the amount of time spent by each member on tasks within your projects. The report displays data in a table organized by user names, tasks, projects/clients, time, and billable time. The report also includes colored charts that visually represent data contained in the report table.

Note: The Time column may change to Hours when the time format in your workspace is set to Decimal hours. Each record in the Time (Hours) and Billable Time (Hours) columns is clickable and leads you to the Detailed report on a relevant user.
Time Range
You can specify the time range for a report, to see what tasks have been performed during this time. Just click the time picker at the right top corner of a report and select a time frame you need.
Filter
You can manage report data with the following filters: Team, Project, Client, Tag, and Billable. Most of the filters have search functionality to help you find the object you need.
Using the Team filter allows a project manager to quickly view all the teams and members who are engaged in his projects.
You can filter the data in the report to show just Invoiced, Uninvoiced, Billable, Non-billable time. This feature allows you to easily check the time that has already been invoiced and what time is yet to be invoiced. You can revert the time marked as invoiced by making it or a portion thereof Uninvoiced. To do this, in the Tasks Summary report, click the Billable time filter, select Invoiced, and click Apply Filter. Then click the Mark Time button and select Uninvoiced. The uninvoiced report can be edited.
When generating a report for the All Time range, you should select at least one project in the corresponding filter.
Groups
You can group report data using the following categories: Project Name, Project Code, User, Task, and Work Type. The categories can be combined by two at a time:
- Click the Group by button and select a category from the First by column.
- Optionally, select the second category from the Then by column.
- Click Apply.
For example, in order to see the tasks performed on a project, you need to group your data first by task and then by project name.
Chart
The pie chart allows you to display data depending on the grouping category you use. If you select two categories, the chart will display data according to the first category you check.
When generating a Tasks Summary report, you can apply the following filters for a chart: Time (Hours), Billable Time(Hours), and Billable Amount.
Note: You can create a chart for Billable Time (Hours) and Billable Amount only in a Professional plan. Chart for Costs is only available in a Business Plan.
Column customization and export
You can easily add or remove columns in a report using the Columns drop-down menu where you check/uncheck the column names you need. When creating a Tasks Summary report, you can select the following columns: User, Task, Project Name, Time (Hours), Billable Time (Hours), and Billable Amount.
Once you finish creating a report, you can export it as a PDF and CSV file.
See Also
Didn’t find what you were looking for?
If you didn't find what you were looking for, you can make a support request or email us to [email protected]. We'll be glad to help you personally.